User manual
The geo-referenced information system has been structured in such a way in order to facilitate the user to easily navigate into the system. It is composed by four different modules, as it is demonstrated in Figure 1, with the modules on the left frame to provide functional utilities such as activating and deactivating thematic layers, enabling the search tool, getting help from the online manual etc. On the other hand, the central positioning frame provides all the information relative to the coastal wetlands as well as navigating utilities provided by Google maps. The modules (sub systems) are comprised of:
2.
The data organization module, entitled “Data catalog”.
4.
The thematic map module, entitled “Mediterranean
basin”.
Figure
1. Structure of modules composing the geo-referenced
information system of wetlands
The noted components are programmatically linked together in order to couple the data retrieval with visualization results.
The actions module
The actions module is consisted of three different tools, namely the "Search", "Wetlands list" and "Click here to give feedback" tools. All the tools are resizable, i.e. users can make each tool smaller or bigger based on their screen resolution, and movable, i.e. users can drag and move any tool wherever they want inside their computer's screen.
Search tool
The search tool enables users to search for specific content in the geo-referenced system. This specific tool retrieves the wetlands according to the country in which they are located, their areal extent and their name, Figure 2.
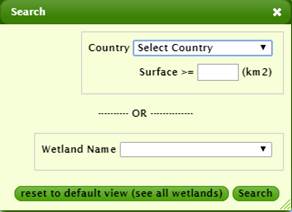
Figure
2. Illustration of the search tool under the actions module
Users can search for a wetland based on one of the previous mentioned criteria or they can combine all the criteria in order to accomplish a more sophisticated search. The major advance in this customized search module is that the results of the search process are directly linked to the wetland layers and only the wetlands which fulfill the criteria set by the user are visualized on the map. This means, that in case the surface criterion is set to equal of bigger to 100 Km2, only the wetlands which fulfill the specific criterion will appear on the map.
Wetlands list tool
The specific tool, Figure 3, enables to zoom in automatically to selected wetlands. When a wetland is selected by the list then the thematic map is triggered to zoom in at the wetland at a 5 km scale.
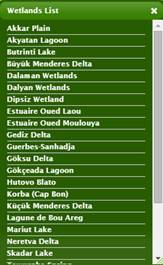
Figure
3. Illustration of the Wetland List tool under the actions
module
Click here to give feedback tool
The feedback menu, Figure 4, appears when users click on the button “Click here to give feedback”. In order for a comment to be sent to the project participants, the person making the comment has to provide his full name and his email address. There are two types of comments: General comments and comments referring to a specific geo-location. In the latter case, users should click on the map and the coordinates of the specific location are automatically integrated into the comments form. Thus, comments related to specific spatial references are supported by the system and are send to the proper recipients.
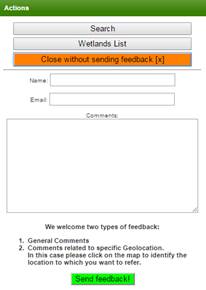
Figure
4. The feedback form for supporting stakeholders’
participation and communicating with the project’s participants
The data organization module
The data catalog is a listing of available datasets including information about the layers which are overlayed on the map. The specific module enables the activation and deactivation of layers related to the wetlands, the Mediterranean basin extent and the project countries.
Moreover, each dataset contains a detailed legend for each layer that appears on the map. The wetlands are categorized in four classes based on their extent, as follows:
·
![]() Area: 0-10 km2
Area: 0-10 km2
·
![]() Area:
10-50 km2
Area:
10-50 km2
·
![]() Area:
50-200 km2
Area:
50-200 km2
·
![]() Area:
>200 km2
Area:
>200 km2
Each wetland type is denoted by balloons with a specific colour, which is indicated in the legend. Small wetlands (up to 10 km2) are white with a black dot, wetlands among 10 Km2 and 50 Km2 are symbolized by an orange balloon, wetlands among 50 Km2 and 200 Km2 by a green balloon, wetlands larger than 50 Km2 are symbolized by a green balloon with a black dot.
The
online manual module
This module provides an online manual which grants information relative to the information stored in the system, guidance on how to navigate navigate in the system and descriptive information about the system modules.
The
thematic map module
The specific module is the viewer of the mapping interface. It includes the 4 different types of base maps which are supported by Maps provided by Google. Moreover, the mapping interface supports the overlaying of the countries boundaries and extents as well as the overlaying of the identified wetlands. The Maps API comes with a handful of built-in controls that are integrated in the map and are the following:
·
The Zoom control: It displays a slider and
"+/-" buttons to control the zoom level of the map. This control
appears by default in the top left corner of the map.
·
The Pan control: It displays buttons for
panning the map. This control appears by default in the top left corner of the
map on non-touch devices.
·
The Scale control: It displays a map scale
element (scale bar in kilometers) and appears on the
bottom right corner of the map.
·
The MapType
control: It allows the user to toggle between map types (such as i.e. standard,
satellite, hybrid and terrain maps). This control appears in the top centre of
the map.
Both countries and wetland layers
are assigned to specific attribute tables. When users click on a country, a pop
up window appears providing data about the country itself, Figure 5. The data
include the following information: Country Name, Country abbreviation, Population
(in Millions), Population density (in inhabitants/km2), Average
rainfall per year (in mm), Average summer temperature (in oC),
Average winter temperature (in oC), Square
Kilometers (SQKM), Square miles (SQMI), Average
yearly tourism (in Millions).
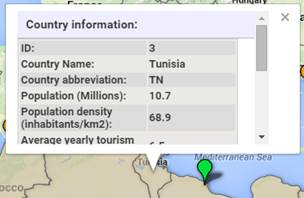
Figure
5. Example of a country information pop up window
When users click on a
balloon representing a wetland, a pop up window with general information about
the wetland and the list of available images (presented as small thumbnails) appears
on the mapping interface, Figure 6.
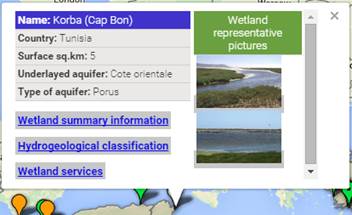
Figure
6. Example of a wetland pop up window
The wetlands' pop up window includes general information for the wetland, such as its name, the country where is located, the surface extent, the underlayed aquifer and the name of the aquifer (only in cases where an aquifer has been identified). Furthermore, it contain 3 links, namely Wetland summary information, Hydrogeological classification and Wetland services.
The wetland summary information triggers the opening of a frame on the right part of the thematic map modules which presents information derived from the questionnaires. The Hydrogeological classification corresponds to the opening of a scheme which demonstrates the classification of the wetland based on its hydrogeological characteristics, Figure 7.
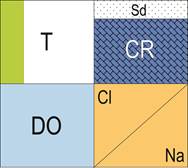
Figure
7. Example of a hydrogeological classification scheme
The Wetlands services corresponds to the opening of a scheme which demonstrates the services of the wetland, Figure 8.
Figure
8. Example of a wetland service scheme
Finally, on the right part of the wetland pop up window, the thumbnails of the representative pictures of the wetland appear. When users click on a picture thumbnail, an enlarged picture appears, and in case of several pictures, users can use the arrows to shift from one picture to another.